Why you need to visualise your marketing funnel – and how to do it

Do you visualize your marketing funnels? Find out why it’s so important, and how to properly use three of the best funnel visualisation tools.
It doesn’t matter what industry you’re in – the end goal for any business is to ensure that their customers or clients complete a particular action that will ultimately lead to conversion.
And as globalization provides fewer entry barriers, businesses need to be extremely creative and innovative to successfully compete in today’s global market.
Tough competition on an international scale has made users very demanding, so it’s crucial to understand and analyze their behavior and adapt to their needs in order to achieve higher conversion rates – and a competitive advantage.
HubSpot published comprehensive research that shows some interesting facts and statistics about marketing funnels. For instance, did you know that only 19% of potential buyers want to discuss product details and pricing during the awareness stage?
There’s no one-size-fits-all marketing funnel
To secure those all-important sales, it’s crucial to create an intuitive and user-friendly website experience that, step-by-step, leads its visitors to a conversion – through a process that works for them. And a marketing funnel can help you to achieve this.
That said, a marketing funnel isn’t a one-size-fits-all solution that brings positive results to all types of business models. Instead, it’s important to create a marketing funnel that will provide your visitors with a unique and user-friendly experience that solves their problems and adds value in their life.
Creating an effective funnel requires experience and industry knowledge that often end up too complex to understand without an intuitive visualization.
But you don’t need to be a graphic designer or engineer to visualize your marketing funnel. Using easily available (and easy to use) funnel visualization tools and frameworks will help beginners to create intuitive graphical representations of marketing funnels.
Why you need to visualise your marketing funnel – and how to do it
Imagine a marketing funnel as a simple roadmap that shows the users a way to the ending goal or conversion.
The journey starts when a visitor lands on a website and takes specific steps that lead to the desired action – a conversion. Funnel visualization is a process that helps businesses to analyze and understand user’s behavior in order to achieve higher conversion rates.
Here are three major benefits of funnel visualization for your business.
1) You can identify and optimize your best (and worst) performing pages
Funnel visualization can help you in identifying your best and worstperforming pages. Visualizing a marketing funnel can reduce the time you need to properly understand users’ behavior, identify opportunities and weaknesses, and create an optimization strategy that will lead to higher conversion rates.
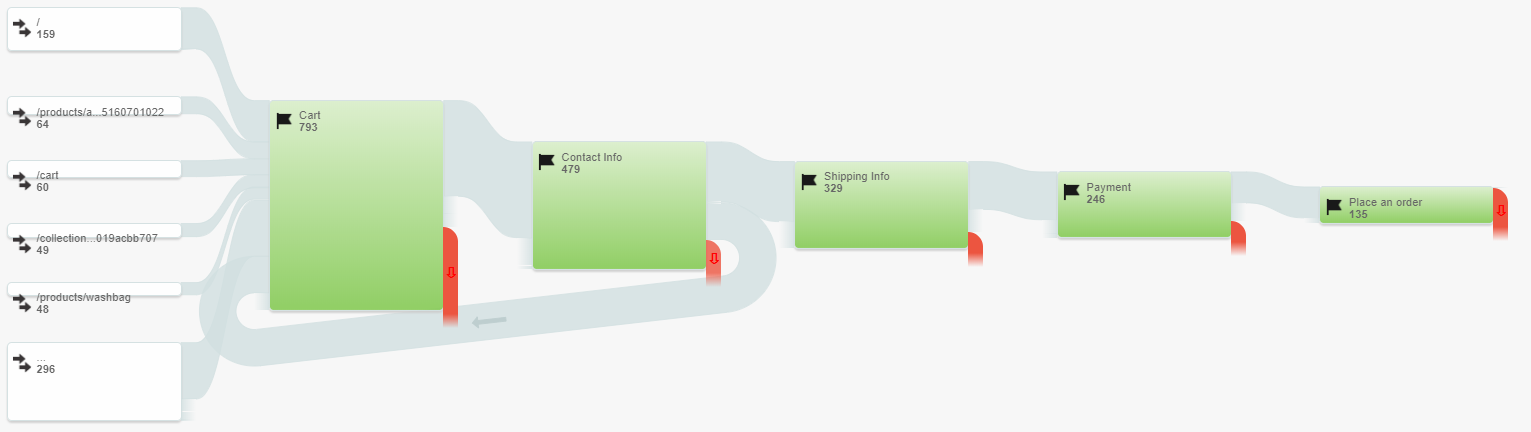
In the picture above, you can see a visualized funnel created in Google Analytics – a free tool developed by Google that provides powerful features such as traffic reporting, conversion tracking, creating custom dashboards, funnel visualization, etc.
The marketing funnel above represents a user’s journey after landing on an e-commerce shop page. The end goal is placing the order (far right). And on the left, you can see the best-performing pages that are leading users to the shopping cart (the first page of this funnel).
2) You can work out where your high quality visitors are coming from
It’s important to know the source of qualified visitors, as this will give you an advantage when attracting more qualified visitors. (A ‘qualified’ visitor is a visitor who’s most likely going to buy your product or service.)
Identifying the highest converting sources of traffic will enable you to develop an effective marketing strategy. For example, if the majority of your qualified visitors land on your site via a Google search query, creating a strategy to increase organic traffic might be the best performing one.
On the other hand, if traffic through social media doesn’t reach your desired conversion rate, you might want to optimize or reconsider your strategy, and invest in another medium that brings better results.
3) It will support you in crucial decision-making processes
Did you know that data visualization reduces meeting time by 24%? If someone isn’t a technical expert, thy may struggle to read, understand and use data.
Presenting a visualized funnel takes an abstract concept and makes it more ‘real’, helping team members and stakeholders to understand the user’s behavior and identify challenges and opportunities for further growth.
Three of the best marketing funnel visualization tools, and how to use them properly
Choosing an intuitive funnel visualization tool, setting up a tracking plan and creating a user-friendly funnel may sound like a very complicated process.
But luckily, there are several tools (both free and paid) that make this process simpler.
In the list below, you can find funnel visualization tools that are free, intuitive, diverse and have the right tools that will make the most complex funnels easy to read and understand.
1) Google Analytics
It doesn’t matter what your industry or business model is, Google Analytics is an important data tool.
Integrating Google Analytics to track your incoming traffic and show it in a graphic form doesn’t require advanced technical skills. Setting up advanced reporting, tracking conversions and visualizing a marketing funnel are a few fundamental aspects of using the power of Google Analytics.
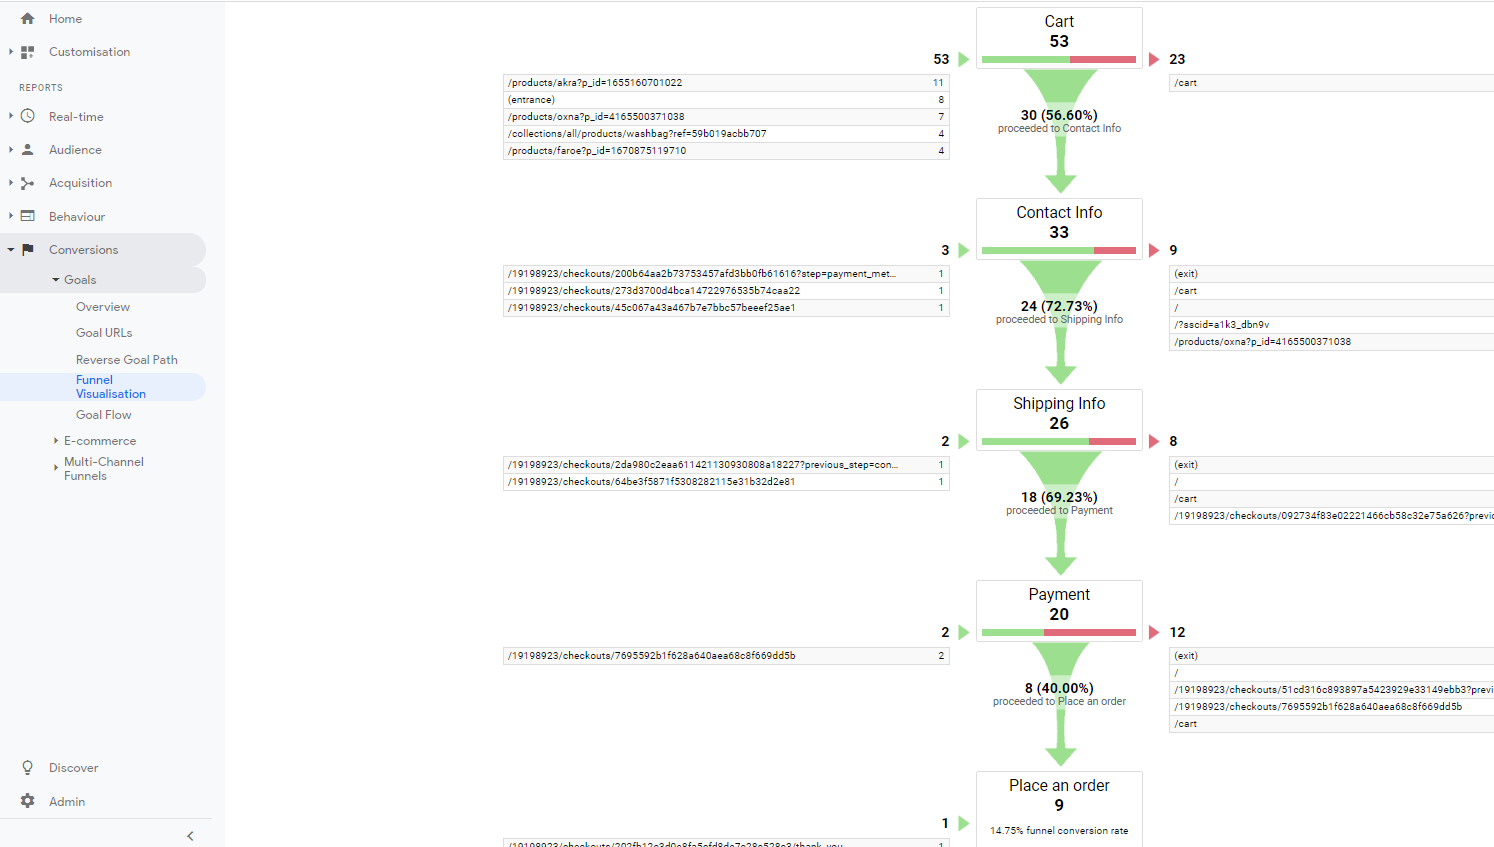
To effectively use Google Analytics for a funnel visualization, the first step is to create specific goals. In the picture above, the main goal is placing the order (the example we’ve used is an e-commerce shop selling clothing products).
Once your goals are set up, click on Conversions -> Goals -> Funnel Visualization and you’ll be able to see a visualized funnel along with conversion rates on each level of the funnel.
As you can see, the top of the funnel features higher conversion rates that drop as users continue their journey to purchase. Funnel Visualization shows the best-performing pages, exit rates, proceeding rate and finally, the percentage of users who’ve ordered a product.
Google Analytics is a very powerful analytical tool that has many features including funnel visualization. Setting up a funnel isn’t complicated, but other tools might give you a more intuitive and user-friendly graphical representation of funnels.
2) FunnelFlows
FunnelFlows is an intuitive and beginner-friendly funnel visualization tool. You can create advanced funnels that are self-explanatory, even to people who’re not in the industry.
The tool functions on a drag-and-drop principle where categorization of icons is extremely detailed, which enables you to create an entire funnel pretty fast.
FunnelFlows constantly adds new features and elements to keep up with a dynamic market and demanding customers. You can create your own funnel template from scratch or use industry leader’s funnels as a starting point.
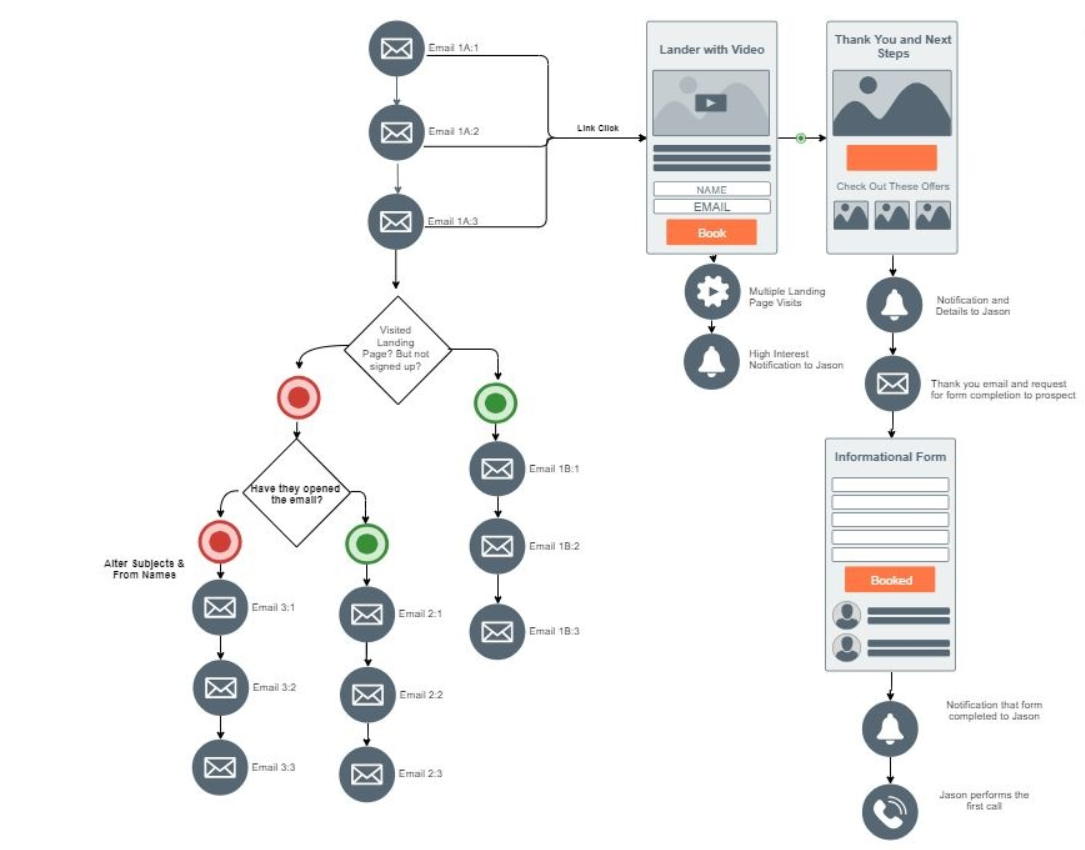
In the picture above, you can see a funnel sample created with FunnelFlows. It represents a marketing funnel for a travel tour company.
Three email versions are sent to users with a link to a landing page featuring a video of travel tour and sign up form. It’s a pretty self-explanatory graph that shows a travel company’s funnel sample that has the potential to deliver higher conversion rates.
3) Funnelytics
Funnelytics is by far the most advanced funnel visualization tool on the list. It comes in two versions – Starter and Pro. The Starter version is free, but it obviously has limitations compared to the Pro version.
If you’re in the marketing funnel planning phase, then you can create detailed funnels using the free version. The pro version comes with advanced features, such as high converting funnel templates, forecasting, tracking the real-time data, identifying best-performing pages, inviting team members and more.
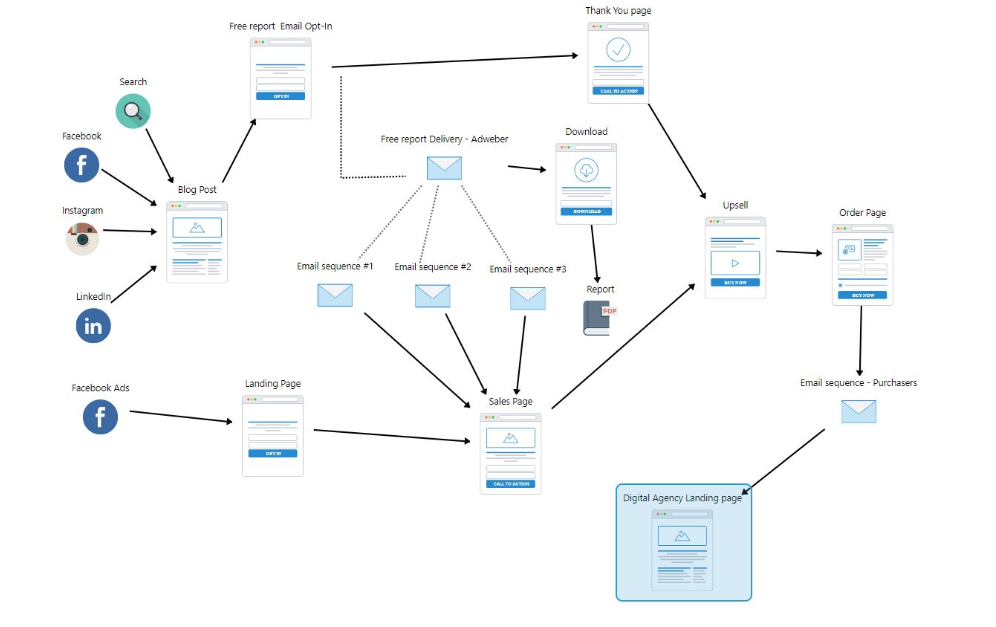
The picture above shows the marketing funnel of a digital agency created in Funnelytics. This example funnel lacks any real data as it’s the free version, but it gives a good overview of the user’s journey to the landing page.
A free version features more than 50 standardized icons, resource pages, templates and more.
Understand your users’ behavior and increase your conversion rate by visualising your funnel
Creating a logical journey that leads users from the initial stage all the way to the final or conversion stage of your marketing funnel is a critical process that will help to determine the success of your business.
Funnel visualization supports behavior analysis and gives you insights that help you to understand the ways to increase conversion rates and business results. And the good news is that with tools like the ones we’ve shared above, you don’t need to a professional designer to create intuitive and user-friendly funnels.–
Josip Mlinaric is e-mail marketing and outreach specialist at Point Visible, a marketing agency providing custom outreach and link building service.
Photo by Elio Santos